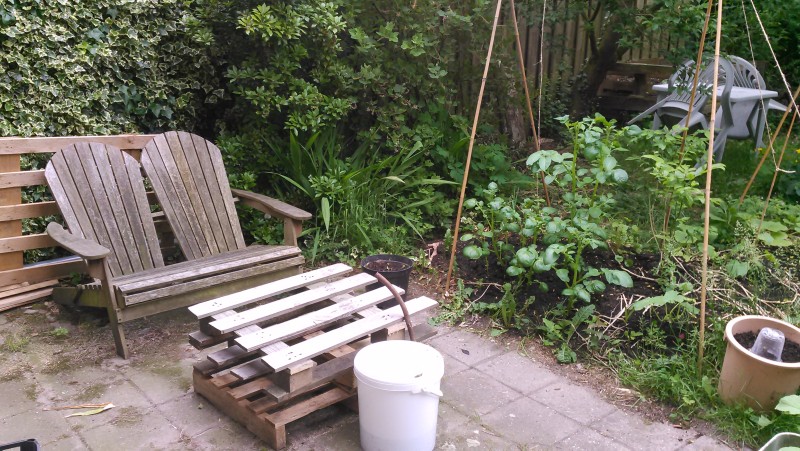
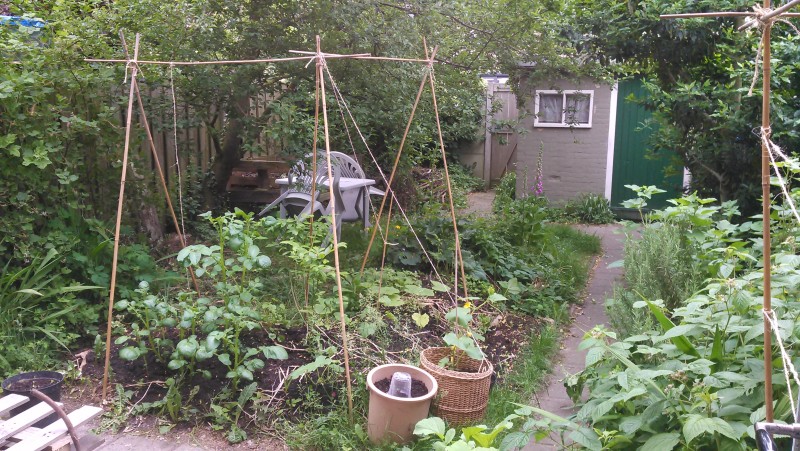
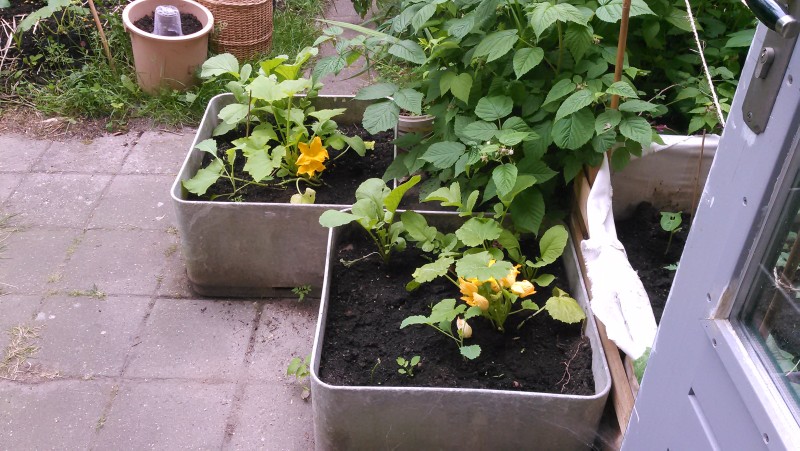
Site information of Arno's backyard
Posted on 2018-05-19 12:00 in surveys • Modified on 2019-08-29 13:57 • Written by Arno Peters
This site information is used in at least the following designs:
- designing Arno's backyard;
- designing the compost bin;
- designing water catchment;
- designing the hugels.
Location and context
My backyard located in an urban neighborhood in Eindhoven, a medium sized city (228000 inhabitants) in the Netherlands.
- Geolocation: 51.44N / 5.43E
- Elevation: 21m
- Soil: sand / sandy loam
- Hardiness zone: 8b - 8
- AHS heat zone: 2
- Climate: moderate maritime climate
- Watershed: Dommel / Meuse (Maas)
- Surface area: 142 m² (42 m² house, 100 m² garden)
- Surface area indoor (3 levels): 90 m² (2x 37 m² + 15 m²)
- Catchment area shed: 3 x 3m (indoor 2.83 x 2.86m)
- Catchment area house: 6 x 6m (indoor 6.21 x 5.77m)
History
From: Wikipedia NL, translated into English
The district is named after the farm "Lievendaal" that previously stood here. The oldest reference of the name is found in documents from 1551.
The first plans to build in the area are from 1930. At that time construction started on the Beatrix canal and a part of the Noord-Brabantlaan was constructed.
The first houses were built in 1941. Those were intended for German officers working at Welschap airfield. In 1950 they were assigned to civilians. In 1948 some 248 houses were finished and in 1949 another 232. In 1951 followed another 212 houses. The construction of all these houses were commissioned by Philips.
In 1958 the Maria Regina church was constructed (demolished in 1978, the tower remains) and in 1960 the 216 appartements along the Welschapsedijk were completed.
In 1966 the Philips van Lenneppark was opened. It lies to the north of the district and was originally designated as industrial area. The same year the Evoluon was built to the east of the district.
For a more detailed history (in Dutch) see here.
Meteorology and climate
Climate: Maastricht Aachen, Netherlands retrieved 2018-05-01
Maastricht Aachen Airport
Latitude: 50-55N, longitude: 005-47E, elevation: 114 m
| Jan | Feb | Mar | Apr | May | Jun | Jul | Aug | Sep | Oct | Nov | Dec | |
|---|---|---|---|---|---|---|---|---|---|---|---|---|
| Max avg. temp. (°C) | 4.4 | 5.5 | 8.9 | 12.6 | 17.3 | 20.3 | 21.9 | 21.9 | 18.8 | 14.5 | 8.6 | 5.4 |
| Min avg. temp. (°C) | -0.6 | -0.5 | 1.6 | 3.8 | 7.6 | 10.7 | 12.4 | 12.3 | 9.9 | 6.8 | 2.8 | 0.4 |
| Precipitation (mm) | 58.9 | 53.2 | 62.2 | 52.6 | 62.2 | 74.1 | 70.6 | 66.4 | 56.6 | 60.5 | 69.4 | 72.8 |
| Precipitation (days) | 20 | 14 | 20 | 18 | 19 | 20 | 17 | 17 | 17 | 18 | 20 | 20 |
| Sunshine (hours) | 1.4 | 2.5 | 3.2 | 4.7 | 6.0 | 5.9 | 5.9 | 5.7 | 4.5 | 3.5 | 1.9 | 1.2 |
Note on days of precipitation: this is the number of days with precipitation ≥ 1mm.
Solar irradiation
In the Nethelands:
- sunny day: 1100 W/m²
- overcast day: between 20 and 300 W/m²
Average global irradiation on a horizontal plane over the time period 1981-2010 in kWh/m2/year in Eindhoven (source: KNMI)
| J | F | M | A | M | J | J | A | S | O | N | D | year |
|---|---|---|---|---|---|---|---|---|---|---|---|---|
| 21 | 37 | 72 | 114 | 150 | 151 | 151 | 131 | 86 | 54 | 25 | 16 | 1012 |
Base map
PASTE
See the full overview of plants, animals, structures, tools and events in 2018.
Image gallery
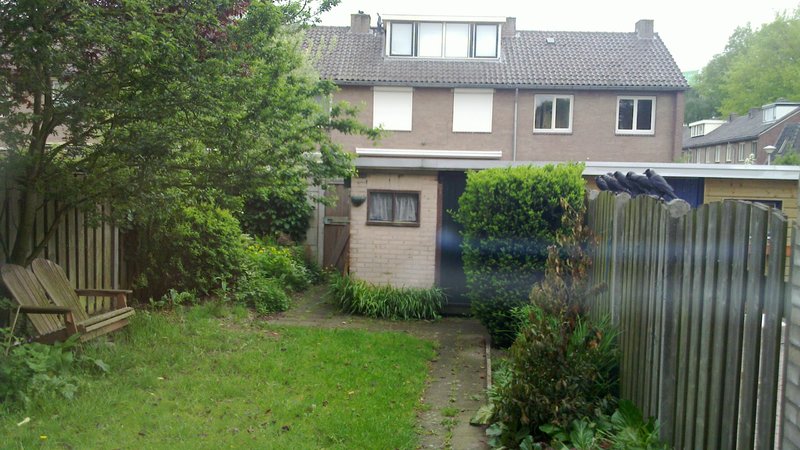
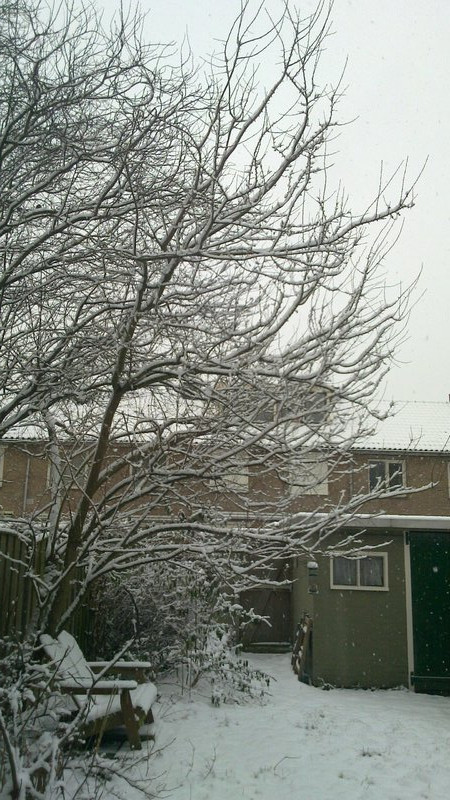
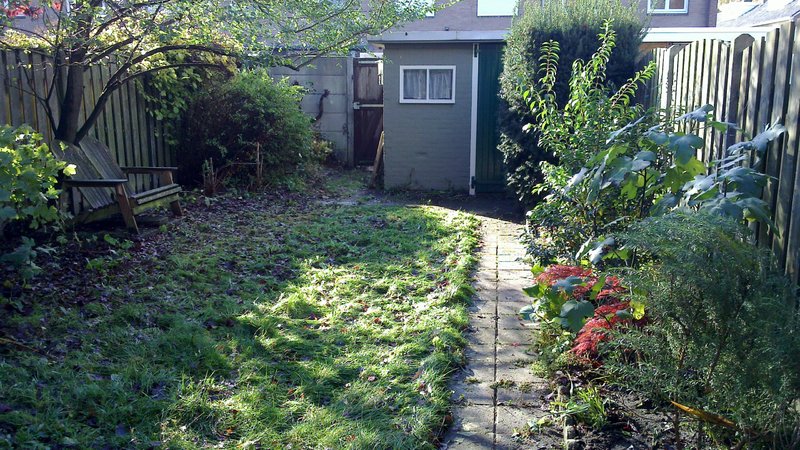
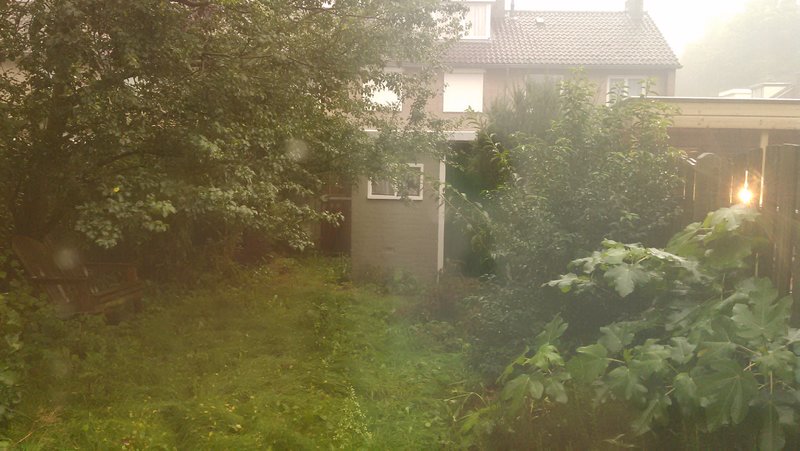
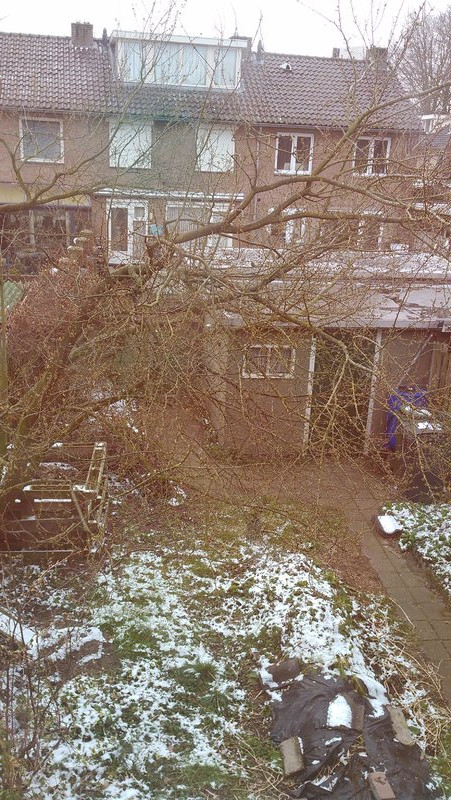
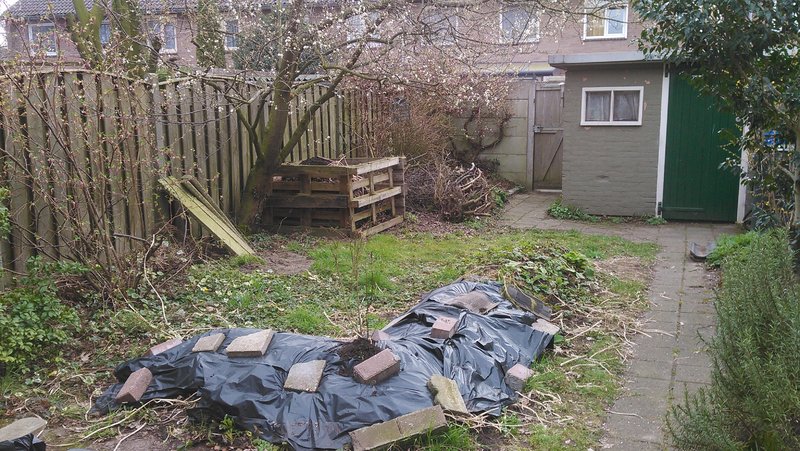
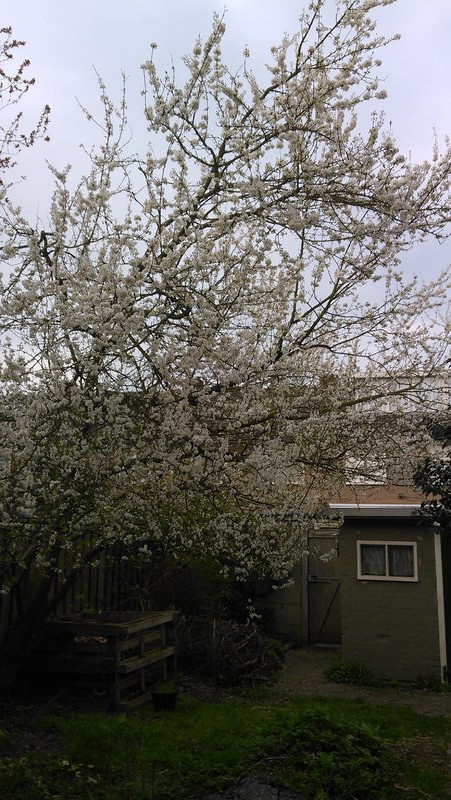
Please note that it does not snow as often as the pictures may suggest. The reason is quite human: we tend to take pictures of exceptional circumstances. A better approach in documenting the garden would be to take pictures at regular intervals and from different, but fixed angles.
2005 / 2006
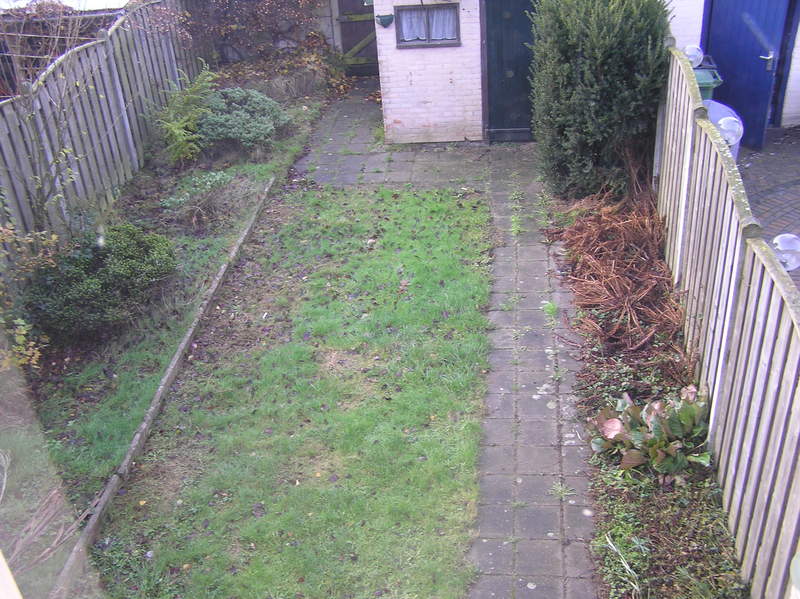
2009
2012, May
2013
2014, September
2015, March / April
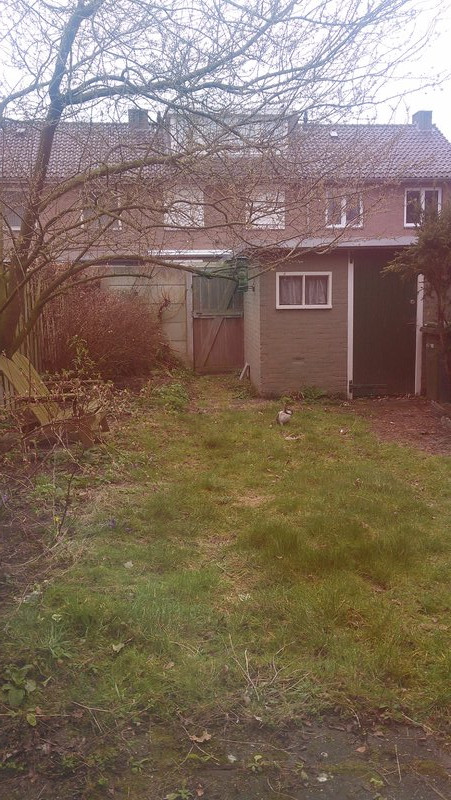
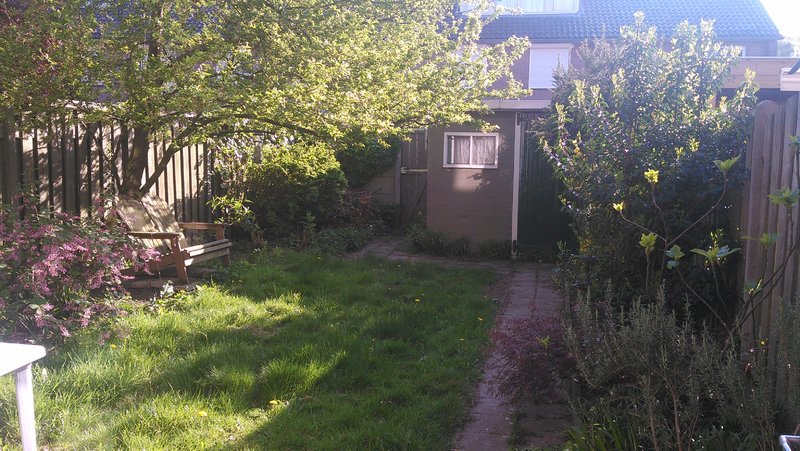
2017, February / March
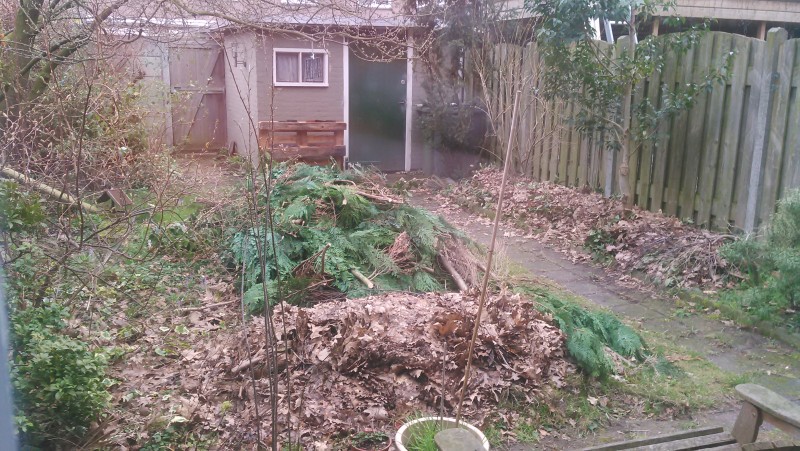
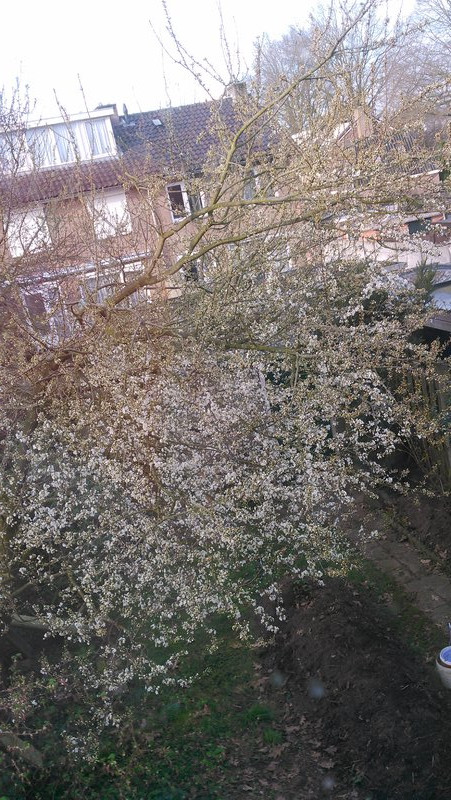
2018, March / April
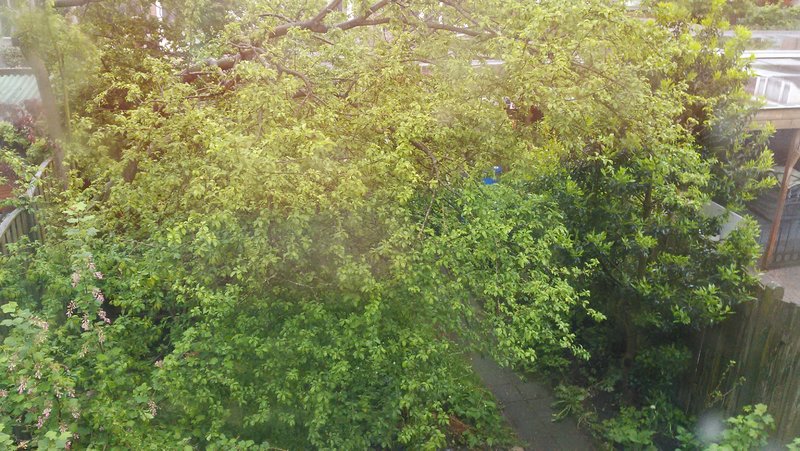
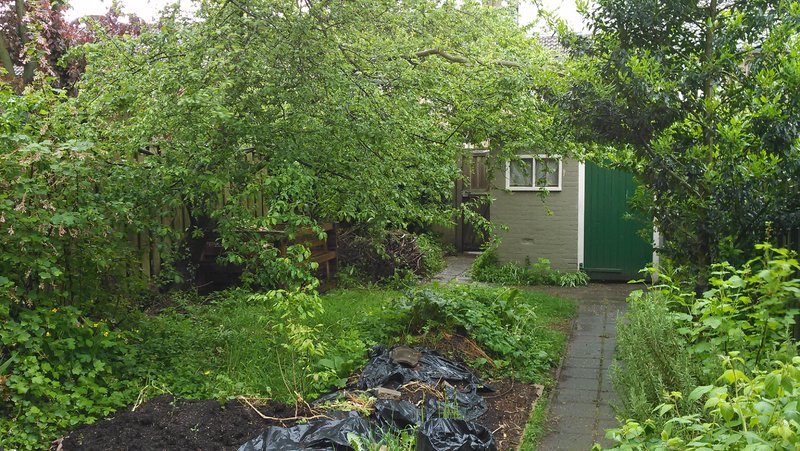
2018, May
