Tracking flows
Posted on 2021-01-31 19:13 in tools • Written by Arno Peters
Let me shed a little light on how I record, track, and plot various streams across my domain.
My Workflow
I have a git repository that holds my records. I clone this repo across the various machines I use. It contains records pertaining to the flows of: money, energy, water and more.
Central to my workflow is Ledger. Ledger is a text based accounting program. I use it to show my balances and summarize my transactions. Most everything I record either is in Ledger format, or small custom programs convert various CSV files into Ledger files. I created a Makefile to help create or update the Ledger files based on new input files.
For example —
- I download my bank records in CSV format. Every export I request from the bank spans from January 1st to the current date.
- make install will detect the newly downloaded file and rename it to csv/2021_ACCOUNTNR.csv where 2021 is the current year and ACCOUNTNR the specific identifier for this bank account.
- make all runs a Python program that converts the CSV into generated/2021_ACCOUNTNR.lgr using a simple matching system for putting expenses and income into appropriate accounts.
I have a top-level Ledger file all.lgr where I include all the different transaction sources into one. I use this for example to generate seperate views on my personal finances, my business and on the combination of the two. You can find more info on that in the blog article Using Ledger-cli for joint finances.
Meter readings
I record the meter readings from gas, electricity and water in a separate csv file: data/verbruik.csv. This file has four columns. The date and one column for each meter. This csv gets converted into the ledger file generated/verbruik.lgr. Below an extract from data/verbruik.csv:
datum,elektra,gas,water
[...]
2021-01-08,28457,31515.18,376.33
2021-01-15,28473,31533.55,377.04
[...]
I wrote a small Python program to calculate the differences between the dates and spit out ledger transactions. The program can also estimate CO₂ emissions from electricity generation and the burning of the gas. These go into their own transaction. See an example below. Each measurement gets its own commodity. Ledger can convert these commodities into each other using commodity pricing. I created si-units.lgr to define the conversions between kWh, J, kJ, MJ, GJ, m³(n), liter(petrol) etc.
# partial from si-units.lgr
P 1970/01/01 00:00:00 kWh 3600000.0 J

# partial from generated/verbruik.lgr
2021/01/15 * Energie elektriciteit
    verbruik:energie:elektriciteit  16 kWh
    omgeving

2021/01/15 * Uitstoot CO₂ elektriciteitsverbruik
    verbruik:CO2:elektriciteit  3.1 kg
    omgeving
Note: verbruik = usage, omgeving = environment.
I communicate with Ina how much electricity, gas and water we used in the previous week. We can usually pinpoint what causes an uptick of drop in usage. We say stuff like: “ah yes, we did laundry twice last week”. A laundry load takes about 90 liters of water. Or “ah yes, we went away for a few days” when there is a drop in usage. I find it creates awareness and establishes a baseline for comparison.
Reporting and Visualization
Another major component to my system is org-mode in Emacs. I have org files containing reports on specific topics: money, energy, expenses, my business, transportation, shelter, projects, investments. I include the various source files I like a report on. I use command line options to Ledger to give me broad overviews or to drill down on specific area’s. When I update these reports, I put them in version control as well.
I also wrote a few Python programs to visualize these various flows. For energy it calls out to Ledger to create the summarized data and then I use Python libraries pandas and matplotlib to visualize the data.
Energy Usage
The output of the program to plot energy usage per month shows me:
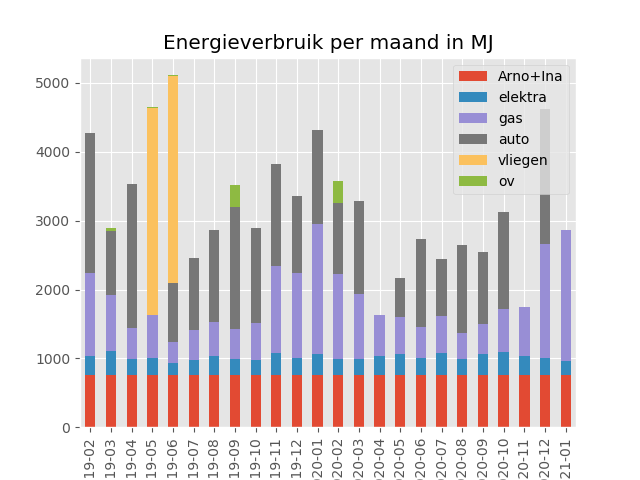
Energy usage
I can clearly see the influence of the seasons on our gas usage. Note my car usage since March, the time of the first Dutch lockdown. It seems I resumed traveling by car again mid-May, though maybe a bit less than before.
Let’s look at the same data, now summarized per year:
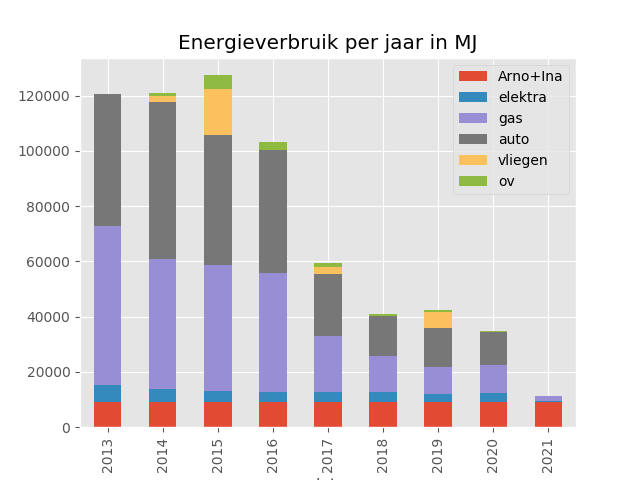
Energy usage per year
From this graph, I see a major turning point was 2017: halving the usage of gas and of car. I note that we did our first PDC in that year. I got to know Ina in 2015. I used public transportation (green, ov) to visit Ina in The Hague.
Fuel Efficiency
Let me share one more graph with you:
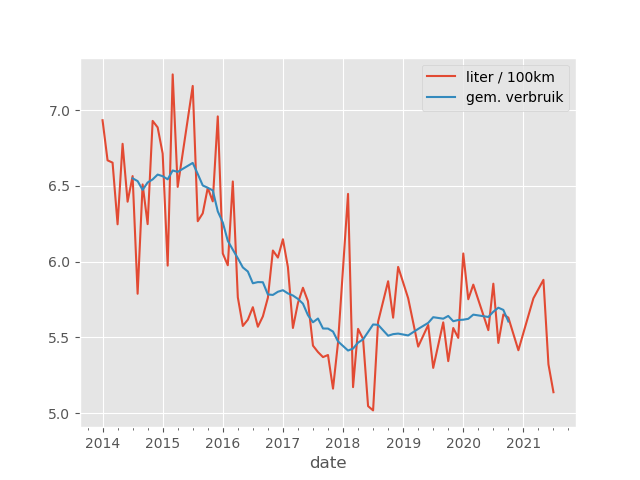
Driving efficiency
This shows the amount of fuel my car needs to travel 100km. Lower is better mileage. The blue line is a smoothed function of the raw data in red. Note the drop in the second quarter of 2016. Going from 6.5 liter/100km to 5.5. That lasted half a year. From 2017Q1 to 2018Q2, I experimented with various ways to get fuel consumption down. Raw data for this graph is: date, odometer reading, fuel taken in, price per liter. Again yet another Python program converts it to Ledger input.
Evolution and Evaluation
The first commit to my ledger repo was end of May 2014. It was an experiment to track my income and expenses directly from the transactions in my bank account. It progressively expanded and transformed to this system. Over time I also imported records from other bookkeeping software I used prior to this. My financial records go back to 2005. I looked at old utility bills to expand records on my energy and water usage going back to 2008-2009.
The nice thing about having all this data in plain text, is the ease to add and adjust. Having git keep track of changes, I can roll back when a change is not to my liking. And since I’m a programmer, I can mold this system the way I like to work.
I’m curious, which parts of this inspire you most? Leave me a comment on the contact page.